Assist agents in the moment, deflect with smart self-service, and turn service data into insight, not a chatbot bolted on.
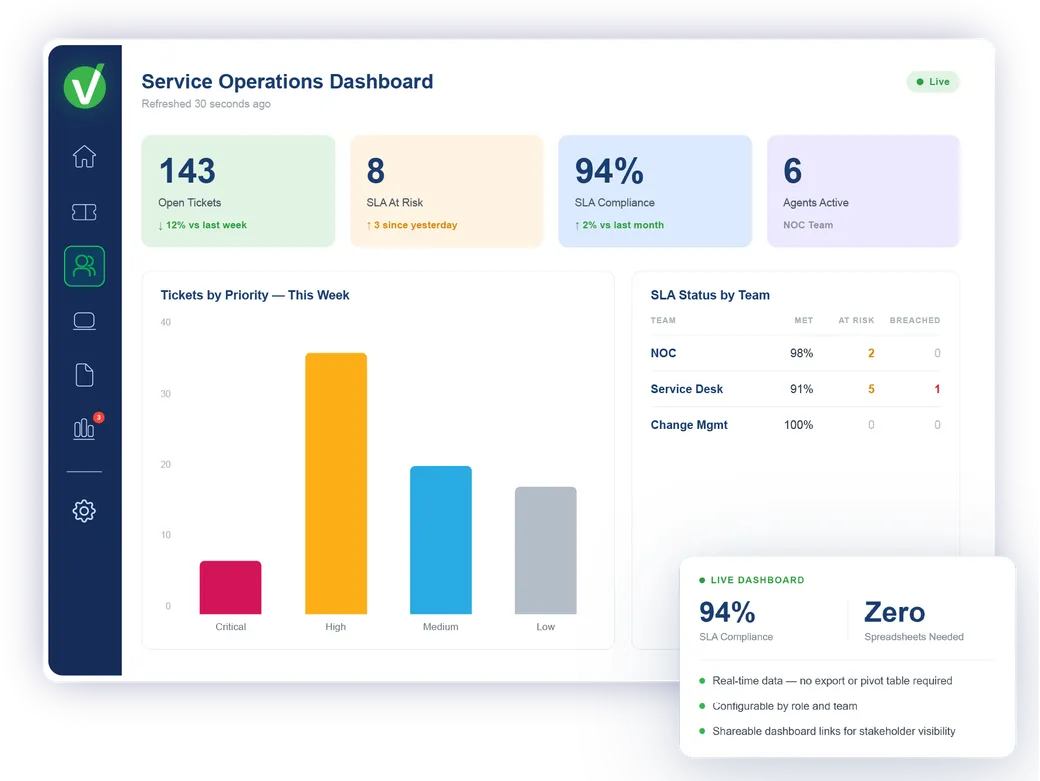
Explore all Vivantio AIReal-time dashboards, SLA performance reports and configurable live data grids — all built into the platform your team already uses. No export, no pivot table, no waiting for someone to run the numbers.
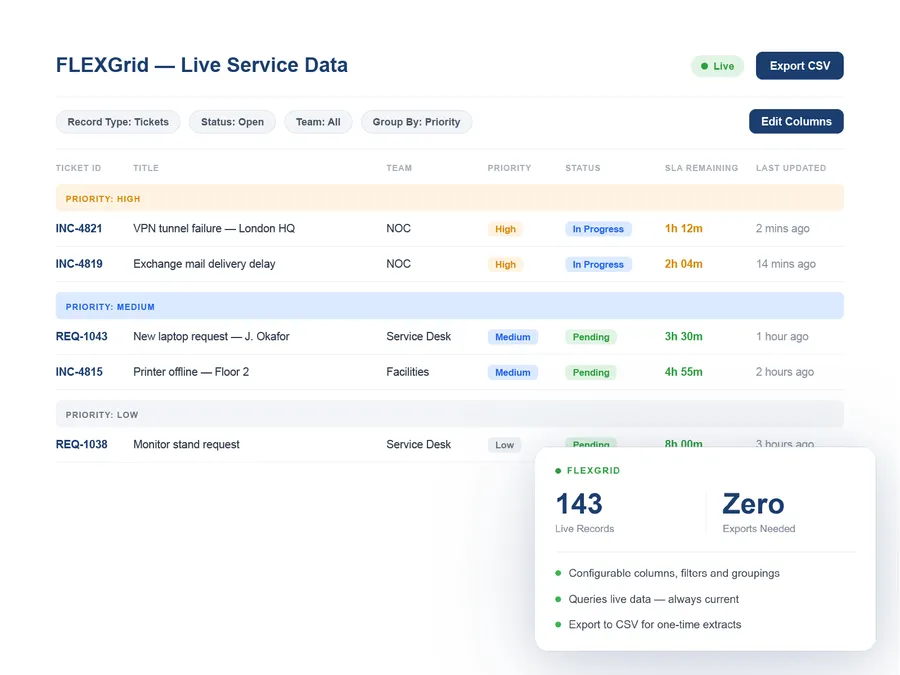
Live data, not a weekly export. FLEXGrid queries the current state of your service operation.

Service teams at leading organizations trust Vivantio


Decisions made on stale exports and manually-built reports miss what's happening now. Capacity problems and SLA risks are only visible when it's already too late to act.
Without live reporting
Weekly service report built manually in a spreadsheet every Friday afternoon
SLA breaches discovered after the fact: not while there's still time to act
Leadership decisions based on data that is already several days old
Capacity problems visible too late: the queue has built before anyone acts
With Vivantio reporting
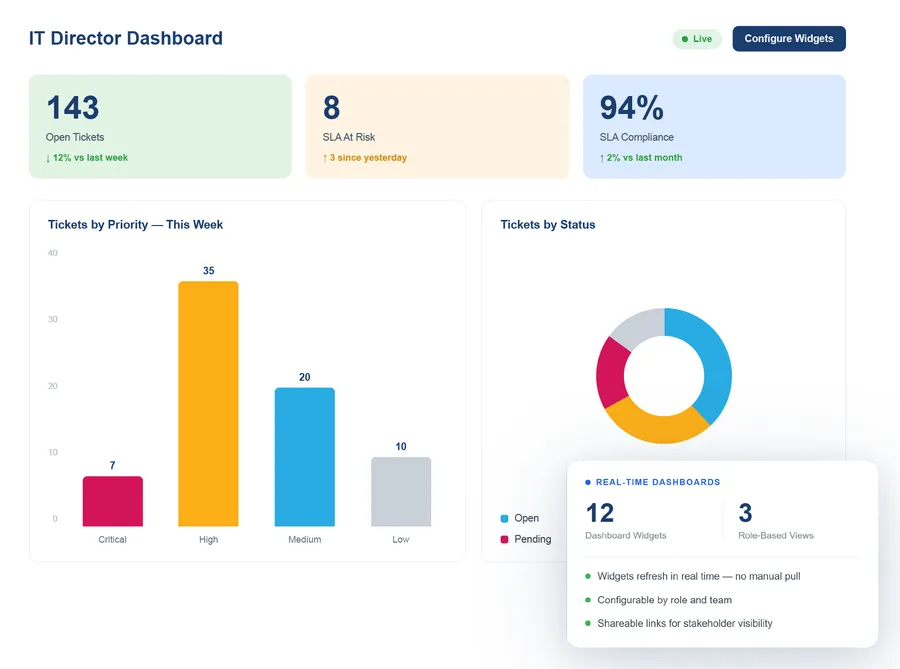
Live dashboards show the current state of every queue, SLA and team
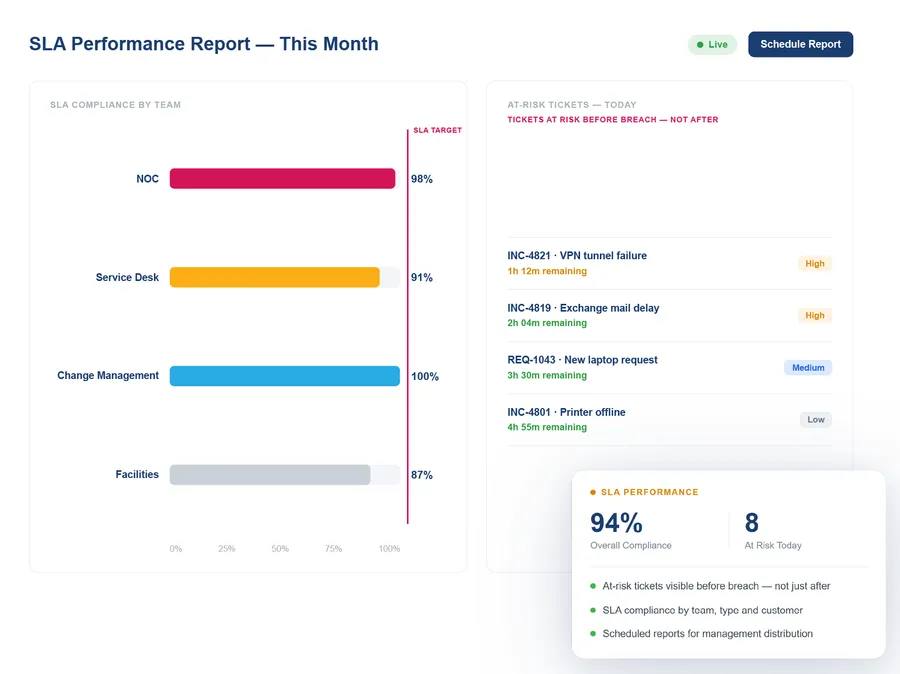
SLA risk visible in real time: act before a breach, not after it's logged
Reports generated from live data in seconds: no manual export, no Friday task
Capacity patterns visible as they emerge: resource decisions made on current data
Vivantio dashboards are built from live service data — ticket volumes, open incidents by priority, SLA status, agent workload, and change activity. Each widget refreshes in real time, so service leaders see the current state of operations rather than yesterday's snapshot. Dashboards are configurable by role and team, so an IT director and a team supervisor see the view relevant to them.

Vivantio SLA reporting shows performance by team, priority, service type, customer account and time period. Leaders see exactly where SLAs are being met, where they are at risk today, and which ticket categories are most likely to breach. At-risk tickets are visible in real time — before the breach happens. Reports can be scheduled for regular delivery to management and customer-facing account reviews.

FLEXGrid is Vivantio's live data grid for service reporting — a configurable, real-time table view of any service data. Teams configure the columns, filters and groupings they need, and FLEXGrid queries live data to show the current state. Useful for ad-hoc analysis, team leads reviewing their queue's health, or service managers answering questions that don't fit a pre-built dashboard widget.

Vivantio includes built-in dashboards, SLA performance reports, agent workload reports, volume trend reporting, and FLEXGrid — a live, configurable data grid for real-time queries on service data. Reports can be scheduled for email delivery, shared with stakeholders, and customised per team or role. No external BI tool or data export is required for standard service reporting.
FLEXGrid is Vivantio's live data grid for service reporting. It provides a flexible, real-time view of service data — tickets, assets, changes, SLAs — with configurable columns, filters and groupings. Unlike static exports, FLEXGrid queries live data so reports reflect the current state of the service operation, not a point-in-time snapshot.
Yes. SLA reporting breaks down performance by team, service type, customer account, priority and time period. Leaders see exactly where SLAs are being met, where they are at risk, and which ticket categories are most likely to breach. Customer-facing SLA reporting supports account reviews and contractual performance conversations.
Vivantio supports data export and API access for teams that want to feed service data into Microsoft Power BI, Tableau or similar tools. For most standard service management reporting — SLA performance, volume trends, agent workload, KPIs — the built-in dashboards and FLEXGrid provide what teams need without an external BI dependency.
We'll show you how Vivantio's reporting fits your management reporting needs — with a demo built around your team's KPIs and service metrics.