Service-to-Renewal Signal Mapping for Early Risk Detection
Three months before renewal, nothing looks urgent.
Nothing looks wrong.
No escalation. Everything is still “green.”
And yet — something is changing.
Ticket volume appears stable.
The account is still marked “green.”
No formal escalations have been raised.
And yet something feels different.
Response times stretch slightly.
Tickets reopen more often.
Collaboration becomes thinner.
No single interaction signals churn.
But the pattern is forming.
In growing service organizations, renewal risk rarely begins in pipeline reports.
It begins in service interactions.
What Is Service-to-Renewal Signal Mapping?
Service-to-Renewal Signal Mapping is the structured practice of aggregating and interpreting support data at the account level to identify early indicators of renewal risk before they surface in commercial forecasting.
Support interactions often contain the earliest indicators of customer churn.
This approach connects operational friction directly to revenue visibility.
For growing B2B service organizations, the goal is not to turn support into sales.
The goal is to make relationship risk visible early enough to act.
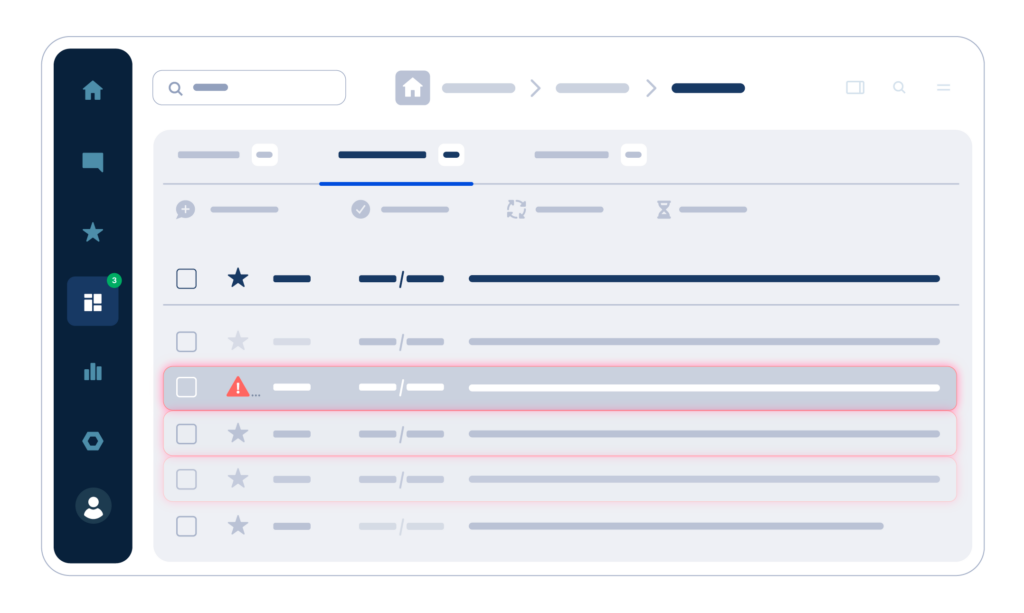
When Renewal Risk Hides in Plain Sight
Churn rarely appears as a single event.
It accumulates.
Early signals often include:
- Increased ticket volume from a single account
- Rising escalation frequency
- Reopen patterns across product areas
- Slower customer response times
- Increased executive involvement in support threads
Individually, these signals are manageable.
Together, they form friction accumulation.
By the time renewal conversations reflect tension, the pattern has usually been visible in service data for months.
“Churn rarely starts at renewal. It starts in service — quietly.”
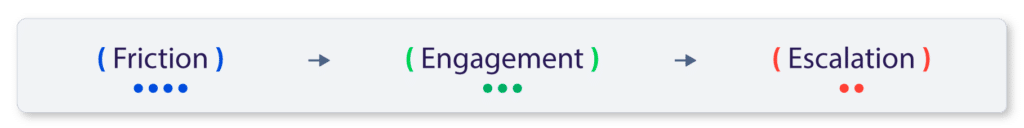
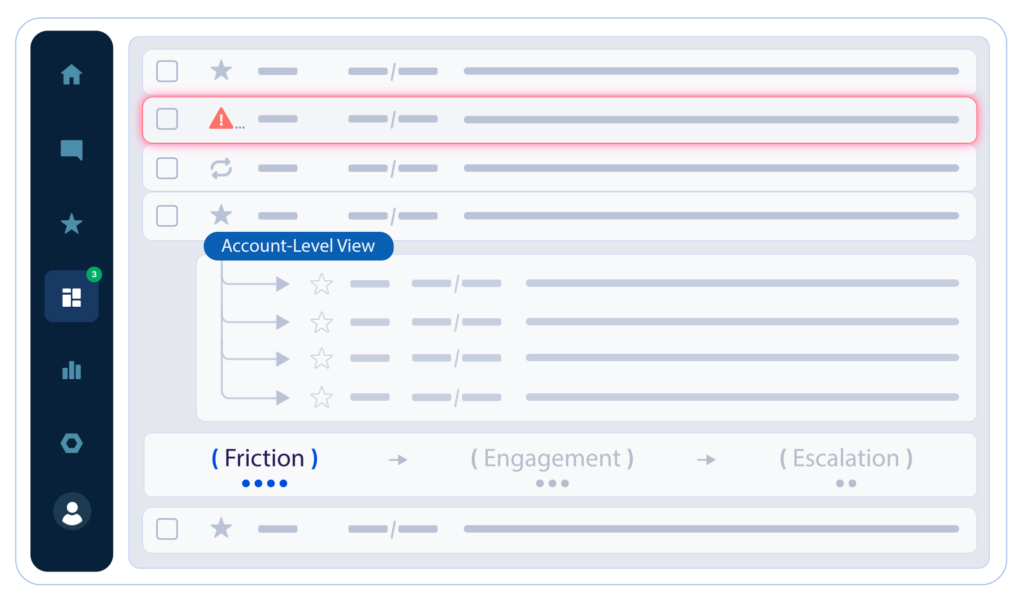
The Service-to-Renewal Signal Map
Renewal visibility improves when signals are structured intentionally.
The Service-to-Renewal Signal Map organizes them into three calibrated categories.
1. Friction Signals (Operational Strain)
These indicate instability in the service experience:
- Volume spikes by account
- Repeat incidents across workflows
- Escalation pathway usage
- SLA near-breach clustering
Friction signals increase risk probability — even when individual issues are resolved.
2. Engagement Signals (Relationship Drift)
These reflect changes in how customers interact:
- Slower response times
- Reduced collaboration
- Lower participation in QBRs or reviews
- Declining product engagement discussions
Engagement drift often precedes commercial tension.
3. Escalation Signals (Visible Risk)
These indicate narrowing recovery margins:
- Executive complaints
- Formal dissatisfaction
- Contract-related friction
- Termination language
At this stage, intervention is still possible — but limited.
Traditional Renewal Forecasting vs Structured Signal Mapping
Traditional Model |
Structured Signal Mapping |
|---|---|
|
|
|
|
|
|
|
|
The difference is not effort.
It is early visibility.
How to Implement Service-to-Renewal Signal Mapping
This is an operational discipline — not a reporting exercise.
Start with five steps:
- Aggregate service metrics at the account level.
- Identify signal patterns that historically preceded escalation.
- Define threshold combinations that trigger review.
- Create shared visibility between service and account leadership.
- Review high-risk accounts monthly — not just before renewal.
Structured visibility does not require advanced AI.
It requires consistent interpretation.
Operational friction often originates in service interactions — not just systems.
Why This Matters at Scale
As customer portfolios grow, relationship complexity compounds.
Without structured signal mapping:
- Renewal conversations become reactive
- Risk feels unpredictable
- Service teams lack commercial visibility
- Account teams lack operational context
Service-to-Renewal Signal Mapping aligns both.
It transforms support data into a stability signal, aligning service delivery with customer outcomes.
Key Takeaways
- Traditional ITIL implementations can introduce unnecessary process drag when governance is applied uniformly across all service work.
- Right-Sized ITIL aligns governance intensity with operational risk and complexity.
- Service teams improve response velocity by allowing low-risk work to move through predefined guardrails.
- Operational signals and leading indicators help teams identify SLA risk before breaches occur.
- The goal is not less governance, but proportional governance.

Further Perspective
Modern customer experience and revenue operations thinking increasingly recognize that service interactions shape renewal outcomes long before commercial conversations begin.
Customer churn is rarely caused by a single failure.
It more often reflects accumulated friction over time.
Structuring service data to surface these signals earlier allows organizations to act before risk becomes visible in forecasting.
The shift is not toward commercializing service.
It is toward making service insight operationally useful.
Operating Insight
Service-to-Renewal Signal Mapping does not add complexity.
It makes existing service data visible in the right context — early enough to act.
The signal is already there.
The question is whether you can see it early enough to act.
Get Your Renewal Risk Early Warning Checklist

Identify early signals of renewal risk using structured service data.
A one-page operational tool used by service teams to:
• Detect friction patterns at the account level
• Identify engagement drift before escalation
• Improve renewal visibility without added overhead


